What is Looker Studio and Why is it Helpful?
Looker Studio is a free business intelligence (BI) tool from Google that allows users to create interactive dashboards and reports by connecting multiple data sources. It provides an intuitive drag-and-drop interface that makes data visualization accessible even for those without a technical background.
Key Benefits of Looker Studio:
- Centralized Data Reporting: Combine multiple data sources into a single report.
- Customizable Visualizations: Create charts, graphs, and tables tailored to your needs.
- Real-Time Data Updates: Connect to live data sources for up-to-date insights.
- Easy Sharing & Collaboration: Share reports with team members or clients effortlessly.
- Google Integration: Seamlessly connects with Google Analytics, Google Ads, Search Console, and more.
What Sorts of Data Connectors Are Available?
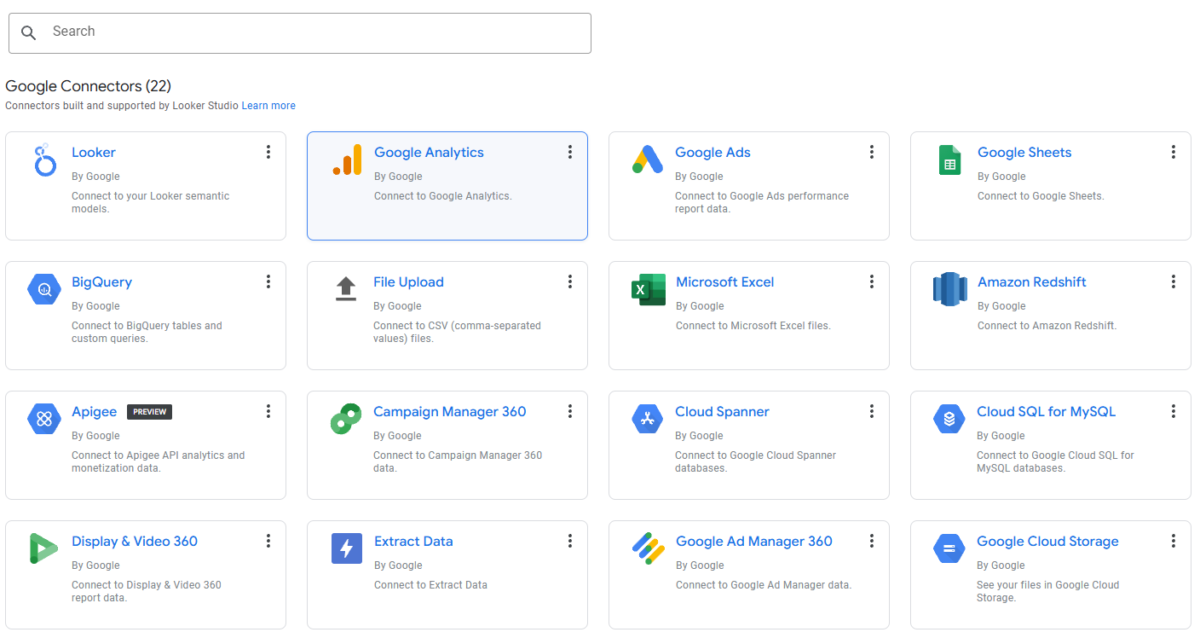
Looker Studio supports a variety of data connectors, allowing users to pull in information from different platforms. Some of the most common connectors include:
- Google Sheets (for custom datasets and manual tracking)
- Google Analytics (website traffic insights)
- Google Ads (advertising performance metrics)
- Google Search Console (SEO performance tracking)
- BigQuery (for advanced data analysis)
- Facebook & Instagram Ads (via third-party connectors)
- Amazon Ads, Shopify, and Other E-commerce Platforms (via paid connectors)
With these integrations, businesses can consolidate their marketing, sales, and operational data into a single, dynamic dashboard.
What Information is Available to Businesses Using These Tools?
By leveraging Looker Studio, businesses can track a wide range of key performance indicators (KPIs), including:
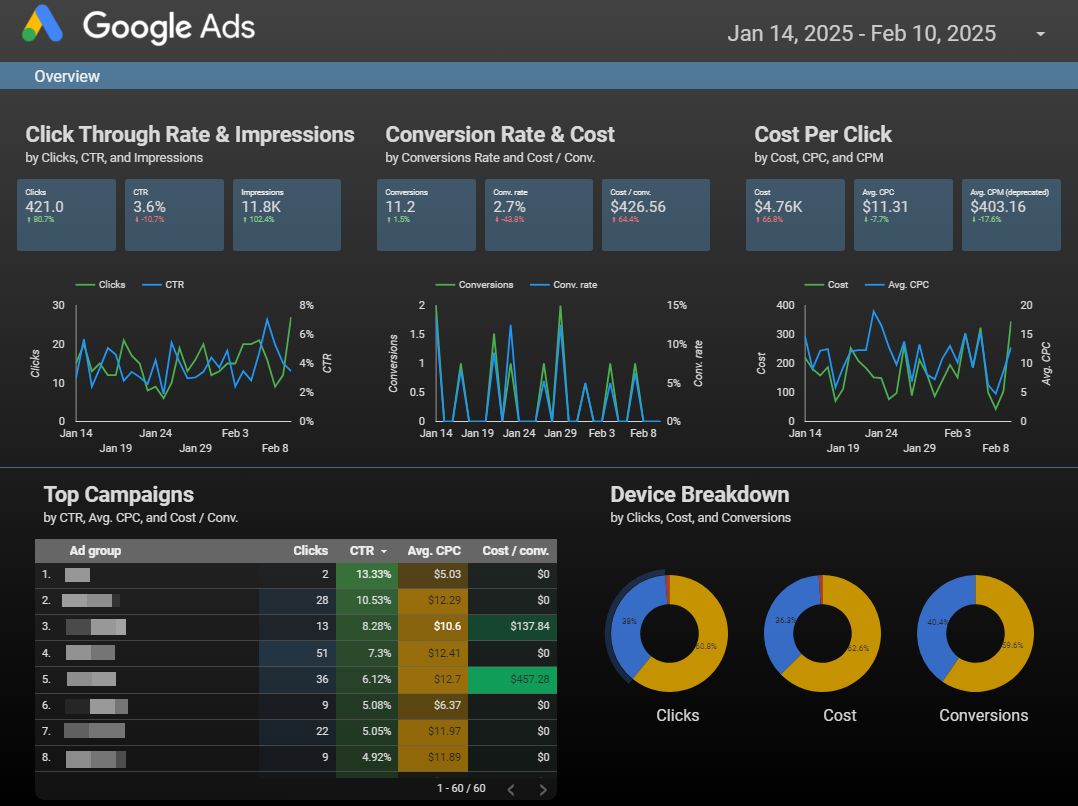
- Marketing Performance: Website traffic, conversion rates, ad campaign effectiveness
- Sales Data: Revenue trends, average order value, customer acquisition costs
- SEO Insights: Click-through rates, keyword rankings, page impressions
- Operational Metrics: Customer support response times, inventory tracking
- Custom Data Analysis: Any manually entered or imported data from Google Sheets
What Are the Benefits of Using Looker Studio vs. Other Competitors?
Looker Studio stands out from other business intelligence and dashboard tools, primarily due to its cost-effectiveness. Unlike many premium tools such as Tableau, Power BI, or Domo, Looker Studio is completely free to use, making it a great choice for small businesses and startups.
Key Advantages of Looker Studio:
- Price: 100% free with no licensing fees, whereas competitors often have costly subscription models.
- Google Ecosystem Integration: Seamlessly works with Google products like Analytics, Ads, and Sheets.
- User-Friendly Interface: Drag-and-drop functionality makes it accessible to non-technical users.
- Customization: Offers robust customization without requiring extensive coding knowledge.
- Collaboration: Real-time sharing and editing allow for easy teamwork, unlike some competitors that require exporting static reports.
- Scalability: While some BI tools require costly upgrades as data complexity grows, Looker Studio scales easily without extra fees.
For businesses looking for an affordable yet powerful reporting solution, Looker Studio is an ideal choice.
How to Create a Simple Dashboard Using Google Sheets
Now, let’s walk through the process of creating a basic dashboard using Google Sheets as the data source.
Step 1: Prepare Your Google Sheet
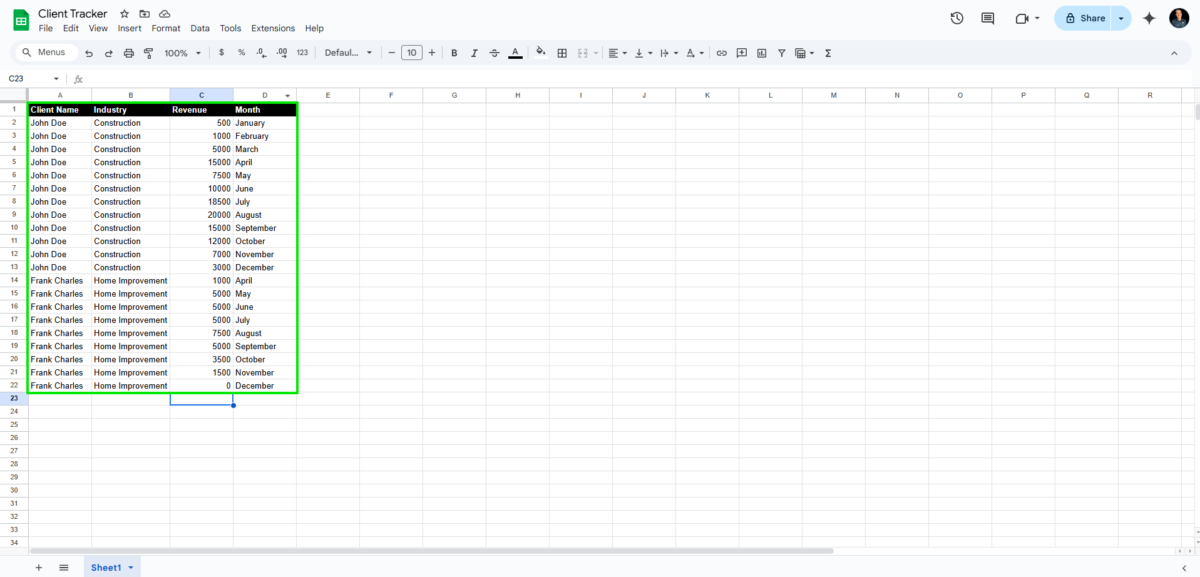
- Open Google Sheets and create a new spreadsheet.
- Label columns with meaningful headers (e.g., Date, Sales, Website Visitors, Conversion Rate).
- Enter sample data or import from an external source.
- Ensure data is structured properly—no blank rows or columns.
Step 2: Connect Google Sheets to Looker Studio
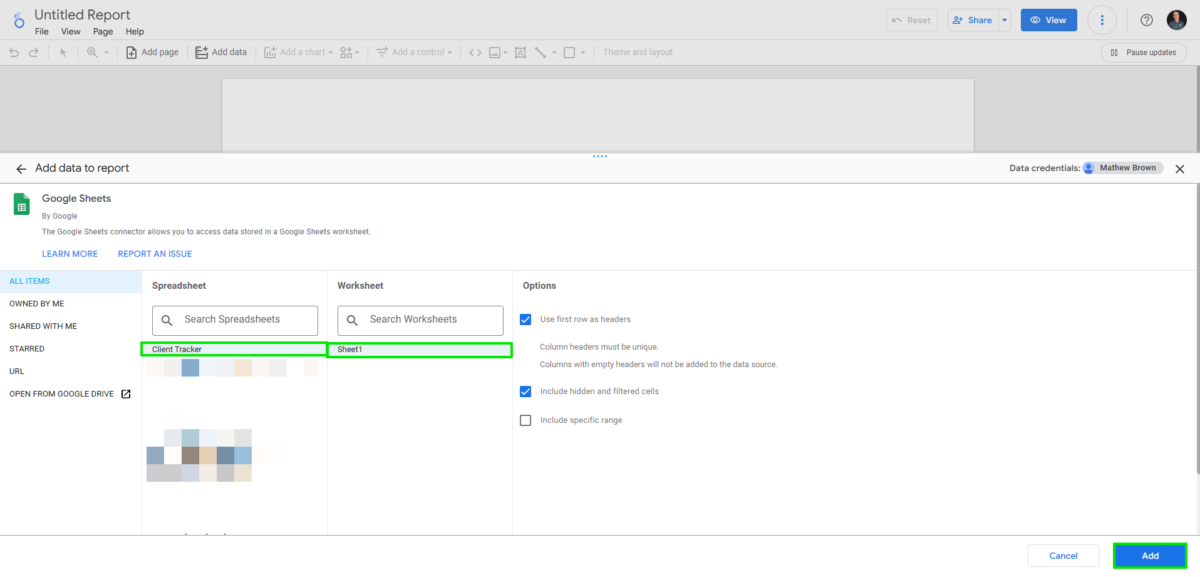
- Open Looker Studio and click Create → Report.
- Click Add Data → Google Sheets.
- Select the appropriate spreadsheet and worksheet.
- Click Add to bring the data into Looker Studio.
Step 3: Design Your Dashboard
![]()
- Use the Chart menu to add tables, scorecards, bar charts, or line graphs.
- Drag and drop data fields to configure your visualizations.
- Apply filters (e.g., date range) to refine your reports.
- Customize the design using themes, colors, and branding.
Step 4: Publish and Share
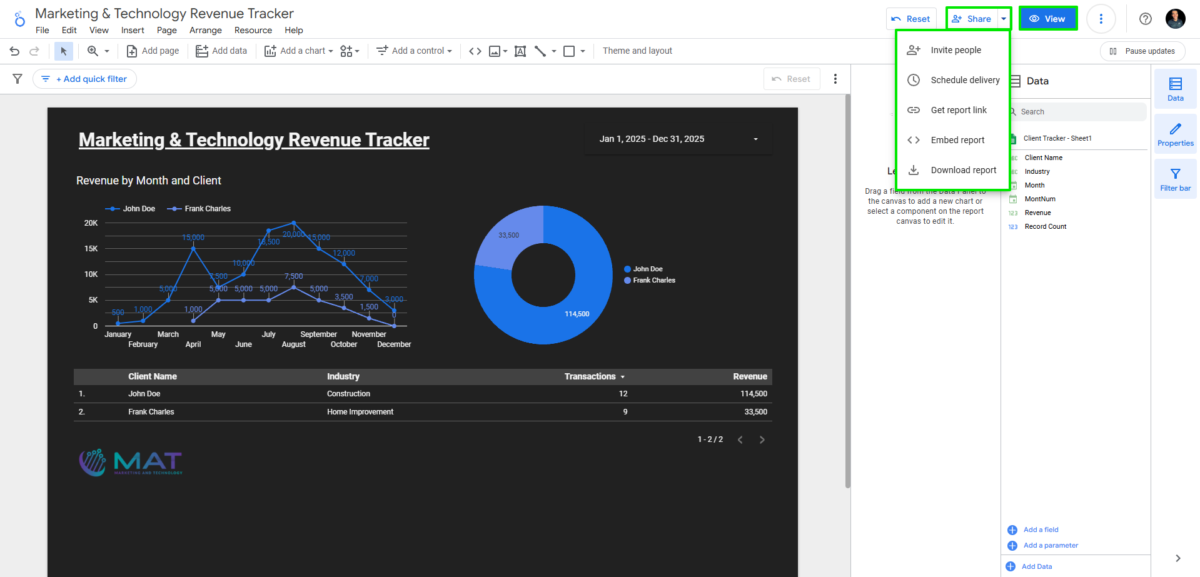
- Click Share and enter email addresses for team members or clients.
- Adjust access settings (View Only or Edit permissions).
- Embed reports on websites or share a public link.
Final Thoughts
Google Looker Studio, combined with Google Sheets, offers an excellent way for businesses to create dynamic dashboards without needing expensive software. Whether you’re tracking marketing campaigns, sales performance, or operational efficiency, these tools provide real-time insights that drive better decision-making.